Get future investor reports for your market
We publish monthly and quarterly data across U.S. metros. Select your market and role and we will send new reports directly to your inbox.

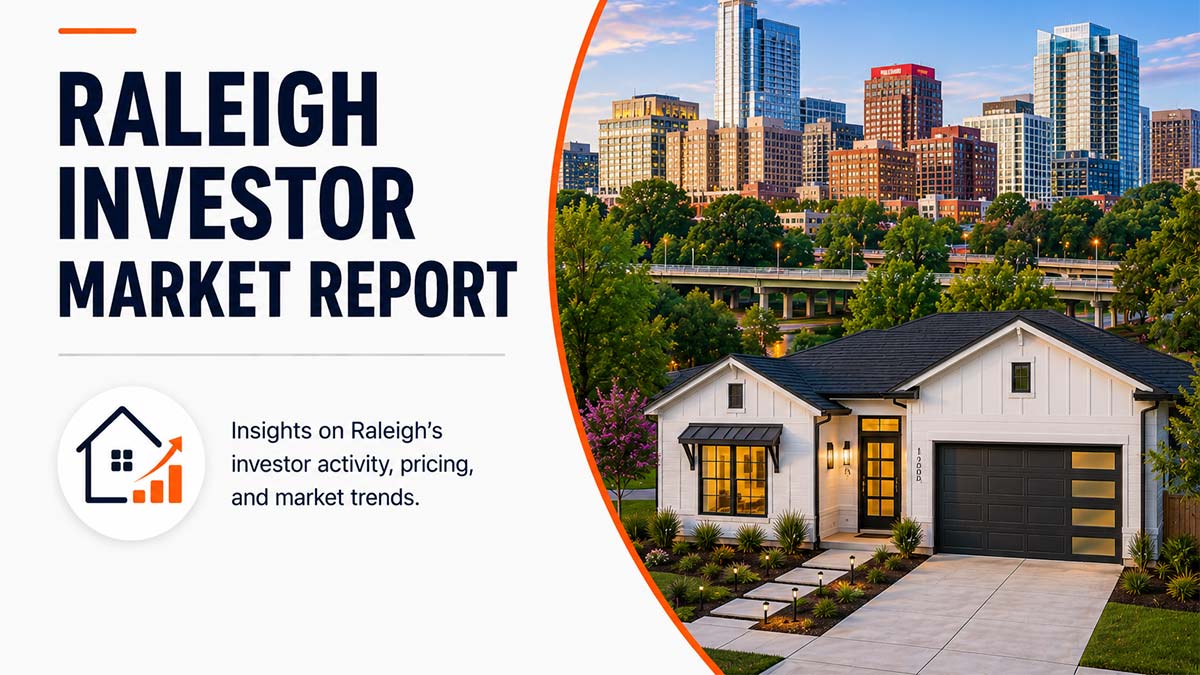
Corporate and LLC-based entities hold 37.7% of the 2,755 single-family residential properties tracked across the Raleigh metro from January through May 2026. The market is defined by two structural characteristics that distinguish it from most other metros in this series: a 49.4% share of investor holdings built after 2000, the second-highest newer-stock concentration in the series after Las Vegas, and a 2020s-built share of 15.6% that is the highest in the series outright. Raleigh investors are not chasing mid-century renovation plays; they are acquiring new-construction and near-new product in a metro where Research Triangle Park, Apple, and Amazon campus expansions have sustained above-average population and income growth for more than a decade.
The iBuyer.com series includes both a monthly (April 2026) and a five-month (Jan-May 2026) Raleigh report. April’s 309-property snapshot showed a 76.7% cash rate; the five-month 60.0% rate on 2,755 properties is the structural baseline. The monthly figure was a period anomaly, likely driven by a concentrated wave of institutional closings in that window. The five-month rate is the more accurate read on how this market actually behaves across a full Q1 and into Q2.
Data sourced and verified by the iBuyer.com Market Insights Team. Coverage period: January 1 through May 31, 2026.
37.7%
Corporate / LLCOwnership Rate
2,755
PropertiesAnalyzed
$456,448
MedianMarket Value
60.0%
CashBuyer Rate
16.6%
Out-of-StateInvestor Share
2,290
Unique InvestorEntities
Thinking About Selling in Raleigh?
With 60% of tracked buyers paying cash and active institutional demand across all price tiers, find out what your home is worth today.
Corporate Ownership Rate
Corporate and LLC-based entities account for 1,039 of the 2,755 tracked SFR properties in Raleigh, a 37.7% corporate rate that places the metro in the mid-to-upper range of this series, above Dallas (32.4%), Houston (35.0%), and Nashville (34.0%), and below Atlanta (52.8%) and Kansas City (48.7%). The 1,281 unique corporate entities behind those 1,039 properties produce a ratio slightly below one property per entity, meaning the typical corporate buyer in this market holds one position. Yet Opendoor Property Trust I’s 69-property lead position signals that national platform capital is actively present even in a market defined largely by local and regional operators.
Opendoor Property Trust I holds 69 properties, Abberly Alston TH LLC holds 40, VB BC LLC holds 37, and Wolfpack RE LLC holds 31. Together those four entities control 177 of the 1,039 corporate-held properties, roughly 17% of all corporate holdings concentrated in the top four buyers. That is above the fragmentation norm for markets with a 1:1 entity-to-property ratio, and it reflects the presence of Opendoor as a scale buyer operating at roughly 3x the next entity’s position. Wolfpack RE LLC’s name is a direct reference to NC State’s wolf mascot, placing it as a local Triangle-area operator with local market knowledge as its competitive edge.
“What we’re seeing here is a market where institutional investors have become significant market participants, with Opendoor Property Trust I alone controlling 69 properties and corporate entities representing 37.7% of all transactions. Just the top four corporate owners account for 177 properties, suggesting both platform-driven iBuyer activity and a build-to-rent ecosystem rather than traditional small-scale investment activity. With 60% cash buyers and a median home value of $456,448, this reflects institutional capital chasing Raleigh’s tech-driven population growth and rental demand from Research Triangle workers. For this corporate presence to ease, we would need either a significant shift in institutional capital allocation away from single-family rentals or a supply surge that makes bulk acquisitions less economically viable.” iBuyer.com Market Insights, Raleigh Analysis, June 2026
Where Investors Are Buying
Investor activity spans 25 zip codes, with zip 27519 (Cary) leading at 202 properties and a 7.3% share, the highest top-zip concentration in this series for a market of Raleigh’s size. The top three zips (27519, 27587, 27610) together account for more than 20% of the entire dataset, a level of geographic concentration that exceeds most other series markets outside Memphis. The distribution reflects two clearly distinct investment corridors: the growth suburbs of western and northern Wake County, and the established affordable corridors of east Raleigh.
Cary (27519) and Wake Forest/Rolesville (27587) carry average values of $594k and $518k respectively, pointing to institutional acquisition of newer construction in the Triangle’s most in-demand suburbs. By contrast, east Raleigh (27610) averages $322k, where per this dataset’s zip-level figures, 90 of the 170 properties went to corporate buyers, the highest corporate count in any single zip in the dataset. That east Raleigh concentration reflects a gentrification-adjacent acquisition strategy, with investors targeting older stock near downtown at below-median prices, while the Cary and Wake Forest positions reflect a parallel turnkey-rental strategy in high-growth outer suburbs where newer homes lease quickly to tech and pharmaceutical sector tenants. The top-ten value spread from $322k (27610) to $594k (27519) is a $272k gap, pointing to investor activity across meaningfully different property types and tenant profiles within a single metro.
| # | Zip Code | Neighborhood | Properties | Share | Avg Value |
|---|---|---|---|---|---|
| 1 | 27519 | Cary (West) | 202 | 7.3% | $593,914 |
| 2 | 27587 | Wake Forest / Rolesville | 189 | 6.9% | $518,000 |
| 3 | 27610 | East Raleigh | 170 | 6.2% | $322,268 |
| 4 | 27526 | Fuquay-Varina | 149 | 5.4% | $435,000 |
| 5 | 27603 | South Raleigh | 110 | 4.0% | $411,000 |
| 6 | 27502 | Apex | 106 | 3.8% | $517,942 |
| 7 | 27604 | North Raleigh (East) | 97 | 3.5% | $389,834 |
| 8 | 27511 | Cary (East) | 94 | 3.4% | $520,000 |
| 9 | 27529 | Garner | 94 | 3.4% | $371,045 |
| 10 | 27606 | Southwest Raleigh / NC State | 93 | 3.4% | $562,459 |
The presence of three Cary-area zips in the top ten (27519, 27502, 27511) with combined activity of 402 properties underscores Cary’s position as the primary institutional acquisition target in the metro. Cary’s master-planned neighborhoods, top-ranked schools, and proximity to RTP make it the Triangle’s highest-demand rental market for professional households. Zip 27606 (Southwest Raleigh near NC State) at a $562k average and 93 properties likely reflects build-to-rent new construction near the university corridor, where Abberly Alston TH LLC’s name (TH = townhome) and Wolfpack RE LLC both suggest a focus on multi-unit residential products within the single-family flag.
Price Tiers
The $400k-$600k tier captures 33.0% of all tracked investor activity (910 properties), with the $250k-$400k tier just behind at 31.3%. Together these two mid-market tiers account for 64.3% of all acquisitions, a combined share that exceeds even Orlando’s 42.7% single-tier record when the two are combined. Raleigh’s nonfarm employment base of approximately 750,000 jobs, driven by technology, life sciences, and state government, per the Bureau of Labor Statistics Raleigh-Cary Economy at a Glance, produces a large professional tenant pool that anchors demand in both the $350k-$500k range (typical professional-household rental) and the $500k-$600k range (senior-professional or dual-income household).
The $456,448 median market value sits above the active-listing median tracked by the FRED Raleigh median listing price series (MEDLISPRI39580) for some periods, an unusual relationship that reflects the quality skew in this investor dataset: the investor-held stock here is predominantly newer construction at higher-than-metro-average prices, not the below-market distressed stock that defines affordable series markets. The average market value of $568,728 produces a mean-to-median spread of 25%, consistent with a market where the $1M+ tier at 8.2% (approximately 226 properties) pulls the average above the median without dramatically skewing it.
Housing Stock
The median year built is 1999 and only 20.2% of tracked properties were built before 1970. The 2000s is the single largest build decade at 20.2% of holdings (556 properties per the chart caption), and the 2020s represent 15.6%, the highest 2020s share in the five-month series. That 2020s concentration is structurally significant: it means investor buyers in Raleigh are acquiring a substantial volume of properties built in 2020-2025, either direct new-construction purchases or very early resales. This is consistent with the build-to-rent pipeline that has expanded significantly in the Triangle, where developers like Abberly Alston (TH LLC pattern) have delivered townhome and detached rental communities specifically designed for institutional ownership rather than individual homeownership.
Median year built: 1999. Pre-1970 share: 20.2% of tracked properties. The Wake County Tax Administration conducts revaluation under North Carolina’s four-year reassessment cycle; the most recent Wake County revaluation was effective January 1, 2024, with notices mailed in early 2024. Market values in this dataset reflect assessed market value at time of Lumentum export. Properties in Johnston, Franklin, and other Triangle-county portions of the MSA are assessed by their respective county appraisers on similar NC four-year cycles.
Full Market Snapshot
| Metric | Value | Signal | Notes |
|---|---|---|---|
| Properties analyzed | 2,755 | Baseline | Smaller dataset; comparable to New Orleans (1,606) and Austin five-month (4,879) in size |
| Corporate ownership rate | 37.7% | Mid-high | 1,039 of 2,755; above series midpoint |
| Out-of-state investor share | 16.6% | Mid | 458 of 2,755; mid-range in series |
| Median market value | $456,448 | Mid-tier | Third-highest in series after Miami $620k, Denver $595k, Phoenix $464k |
| Average market value | $568,728 | Reference | Mean-to-median spread ~25% |
| Cash buyer rate | 60.0% | High | 1,652 of 2,755; five-month baseline vs April monthly’s anomalous 76.7% |
| Median property size | 1,897.5 sq ft | Reference | Largest median footprint in series; exceeds Dallas 1,888 sq ft and Phoenix 1,805 sq ft |
| Built pre-1970 | 20.2% | Newer stock | Median year built 1999; 2020s share (15.6%) is highest in series |
| Unique corporate entities | 2,290 | Fragmented | Includes all investor types; 1,281 are corporate entities |
| Active zip codes | 25 | Broad | Activity spans Wake, Johnston, Franklin, and Harnett counties |
Who Is Buying
Opendoor Property Trust I holds 69 properties as the series’ familiar iBuyer platform maintains its position in a market where single-listing turnover is rapid and its automated acquisition model aligns with the high-volume Cary and Wake Forest submarkets. Abberly Alston TH LLC (40 properties) is likely an entity associated with Abberly, a multi-family and build-to-rent developer active in the Southeast, with the TH designation suggesting a townhome-specific vehicle. VB BC LLC (37 properties) is a less well-known entity, possibly a private equity backed rental operator using an opaque naming convention, which is common in structured SFR borrowing vehicles. Wolfpack RE LLC (31 properties) is the local operator in the top four, named for NC State’s team, and is consistent with a Triangle-native investor running a targeted mid-market portfolio.
| Rank | Entity | Properties | Profile |
|---|---|---|---|
| 1 | Opendoor Property Trust I | 69 | iBuyer platform; multi-market series presence; named, not linked |
| 2 | Abberly Alston TH LLC | 40 | Build-to-rent townhome developer; first five-month series appearance |
| 3 | VB BC LLC | 37 | Structured SFR vehicle; first series appearance; opaque naming pattern |
| 4 | Wolfpack RE LLC | 31 | Local Triangle operator; NC State-adjacent; first series appearance |
The absence of Tricon, FKH, Alto Asset, or PR Borrower 27 LLC from the Raleigh top four is notable given those entities’ broad multi-market presence. Raleigh has not yet attracted the same depth of national institutional SFR capital as Jacksonville, Orlando, or Dallas. The top-four entities here are a mix of one national iBuyer platform, one build-to-rent developer, one opaque structured vehicle, and one local operator, a composition that reflects a market transitioning from primarily local to selectively national institutional, but not yet fully institutionalized.
Sell Your Raleigh Home to a Cash Buyer
With 60% of tracked buyers paying cash and active institutional and local operators across all 25 zip codes, see what your property is worth in today’s market.
Market Implications
- Price in the $400k-$600k range to access 33.0% of corporate demand; that tier moved 910 tracked properties
- In 27519 and 27587 ($594k-$518k avg), institutional demand for newer Cary and Wake Forest stock is strongest
- Target cash buyers; 60% of tracked investors skip financing contingencies and close faster
- 2000s-built and 2020s-built homes together represent 35.8% of investor stock; newer product is in active demand
- In 27610, 90 of 170 sales went to corporate buyers; coach seller clients that cash offers are the norm here
- For buyer clients, 27502 (Apex, 28 corporate buys) and 27511 (Cary East, 33) have lower corporate density
- Pitch the $250k-$400k tier where 31.3% of volume moves; less top-end competition than the $400k-$600k peak
- Opendoor’s 69 purchases confirm iBuyer activity is real here; discuss as a listing option for qualifying properties
- Avoid 27610 (East Raleigh) where corporate buyers took 90 of 170 tracked sales at a $322k avg
- Target 27502 (Apex) and 27511 (Cary East) where corporate concentration is lower despite similar pricing
- Bring cash or have pre-approval locked; 60% of competing buyers close without financing
- Focus above $600k where 18.0% of investor activity concentrates vs 33% in the $400k-$600k tier
Reading the Signals
Q1 Through Q2: The April Anomaly Corrected
Raleigh is the only market in the five-month series that also has an April monthly report, which showed a 76.7% cash rate on 309 properties. The five-month rate of 60.0% on 2,755 properties is the structural baseline. April’s 76.7% was a period anomaly, likely reflecting a concentrated wave of institutional closings in that month (Opendoor, Abberly Alston, or other bulk-close operators can skew a single month’s cash rate significantly when their pipeline clears). The five-month window, spanning full Q1 and the April-May Q2 ramp, smooths that noise. The corrected read is 60.0% cash, a high rate by any market standard, but not the extreme 76.7% that the April snapshot suggested. This is the pattern the Austin five-month and monthly comparison established earlier in the series: the five-month baseline is the more accurate structural signal.
The Build-to-Rent Signal: 2020s at a Series High
Raleigh’s 15.6% share of investor-held properties built in the 2020s is the highest in the five-month series. No other market comes close: Las Vegas is second at roughly 5%, Phoenix at 3.2%, Orlando at 3.9%. That gap is not a data artifact; it reflects the Triangle’s specific policy and developer environment. Wake County and surrounding municipalities have permitted substantial build-to-rent (BTR) townhome and single-family detached rental community construction over the past several years. Entities like Abberly Alston TH LLC are precisely the vehicles through which institutional developers deliver this product to market. When 15.6% of all tracked SFR investor acquisitions in a five-month window were built in the last five years, it signals that Raleigh’s investor market is not just holding existing stock, it is absorbing newly delivered purpose-built rental inventory at significant scale. That dynamic will intensify heading into summer and through 2026 as additional BTR completions deliver to market and are immediately absorbed by the institutional ownership pipeline.
The Dual-Corridor Pattern: Cary and East Raleigh
Phoenix has its outer-ring affordable corridor and luxury Scottsdale tier. Raleigh has its own bifurcation: Cary/Wake Forest/Apex to the west and northwest, and East Raleigh to the east. The western corridor (27519, 27587, 27502, 27511) averages $510k-$594k and is dominated by newer construction, professional tenants, and investor strategies centered on rental yield from stable long-term leases. The eastern corridor (27610, 27604, 27529) averages $322k-$390k and is dominated by older stock, a more affordable acquisition price, and investor strategies centered on value-add renovation and urban-proximity price appreciation. The coexistence of both in the top ten without a single corridor dominating suggests Raleigh’s corporate investor community has a more diverse strategy set than single-thesis markets like Memphis (distressed affordable) or Orlando ($250k-$600k institutional turnkey). That diversity is a structural feature of the Triangle’s income inequality and geographic growth patterns, and it is unlikely to collapse toward a single thesis as the metro continues to expand.
Frequently Asked Questions
Methodology
Data sourced and verified by the iBuyer.com Market Insights Team. Coverage period: January 1 through May 31, 2026.
Ready to Sell Your Raleigh Home?
Connect with cash buyers across all 25 tracked zip codes, from Cary to East Raleigh. No repairs, no contingencies, no waiting on lenders.

Reilly Dzurick is a licensed real estate agent with over six years of experience and a member of the iBuyer.com Market Insights Team, covering national trends in home selling and the evolving iBuyer landscape. Her firsthand experience working with buyers and sellers gives her a practical perspective on how these platforms impact real homeowners. She holds a degree in Public Relations, Advertising, and Applied Communication.