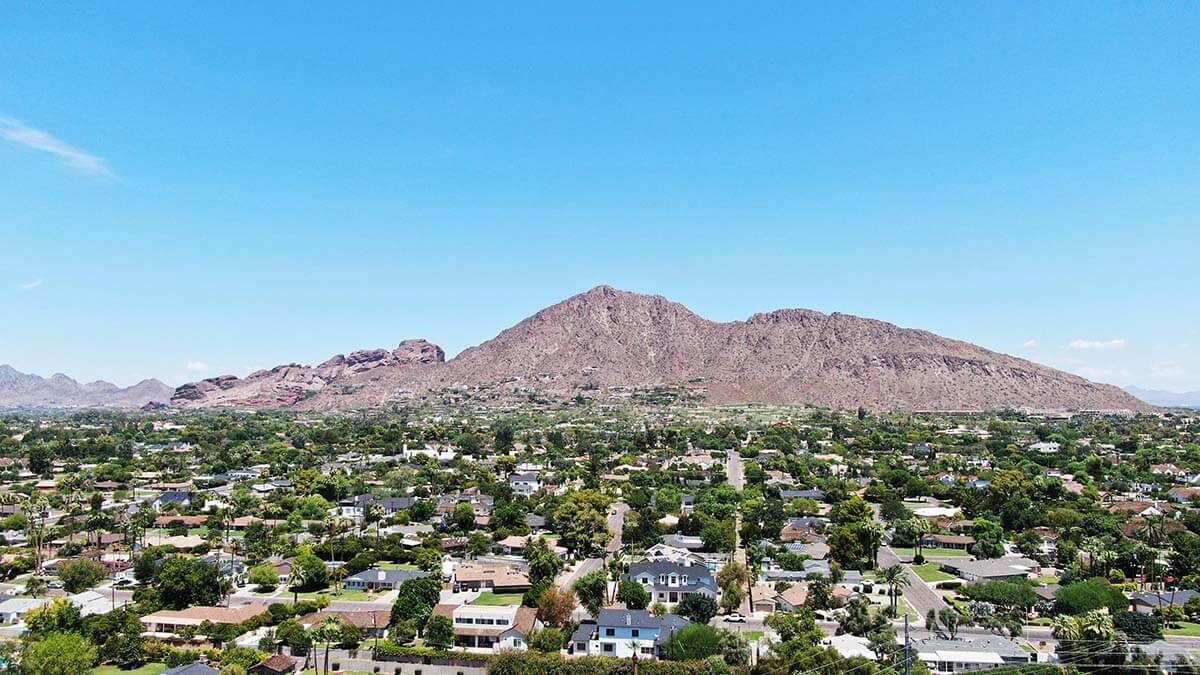
The Phoenix housing market in mid-2026 is tilting firmly toward buyers, with a median sale price of $460,000, active inventory up roughly 27% year-over-year, and more than 31% of listings receiving price reductions before closing. The Maricopa County housing market has undergone what local observers call a “historic shift,” as rising supply and flat demand reverse the pandemic-era seller’s advantage.
Phoenix home prices 2026 figures vary meaningfully by source: Redfin reports a 5.2% year-over-year decline while Zillow shows just 2.4%, and the gap has a straightforward explanation rooted in methodology. This guide explains which figures to trust for which decisions and what both buyers and sellers should expect through the rest of the year.
This guide covers current prices and phoenix housing market trends, the buyer vs. seller market balance, migration and outmigration patterns, climate risk, neighborhood safety, and the phoenix housing market forecast 2026.
Table of contents
- Phoenix Housing Market: 2026 Conditions
- Are Housing Prices Falling in Phoenix?
- Is Phoenix a Buyer’s or Seller’s Market?
- Phoenix Migration: Who’s Coming and Going
- Why Are People Moving Out of Arizona?
- Will Phoenix Be Livable in 10 Years?
- Neighborhoods to Avoid in Phoenix
- Phoenix Housing Market Forecast 2026
- Sell a Home in the Phoenix Metro
- Frequently Asked Questions
Sell Your Phoenix Home on Your Terms Get competing cash offers and close in as few as 7 days, no agent required.
No repairs, no commissions, no contingencies.
Phoenix Housing Market: 2026 Conditions
The phoenix real estate market entered 2026 in a clear cooldown. Inventory is near decade highs, median home price phoenix has declined from its 2022 peak, and price reductions are routine across the metro. The table below summarizes the five most-tracked metrics as of spring 2026, with named sources for each figure.
Current home prices and recent trends
Phoenix housing market trends shifted noticeably in late 2024 and continued through early 2026. Per Phoenix median home prices from Redfin, the median closed-sale price was $460,000 in March 2026, down 5.2% year-over-year. Zillow’s April 2026 data places the average estimated home value at $411,323, down 2.4%. Active listing prices sit higher, around $485,000, per Norada’s April 2026 report. These three figures are not contradictory; each measures a different thing.
The Phoenix home price index history tracked by the Federal Reserve shows the current correction began from a July 2022 price peak, after values surged more than 40% during the pandemic run-up. Phoenix home values remain above 2019 levels in absolute terms for long-term owners, but buyers who purchased at the 2022 peak face paper losses.
| Metric | Current Figure | YoY Change | Source |
|---|---|---|---|
| Median sale price | $460,000 | -5.2% | Redfin, March 2026 |
| Average home value (estimated) | $411,323 | -2.4% | Zillow, April 2026 |
| Median listing price | $485,000 | -3.96% | Norada, April 2026 |
| Active listings (July 2025 peak) | ~24,300 | +27% YoY | Redfin |
| Days on market | 51 to 66 days | Up sharply vs. 2022 | Redfin, March 2026 |
| Price-reduction rate | 31%+ of listings | Elevated vs. prior years | Norada, May 2025 |
Based on Redfin, Zillow, and Norada data, 2026. Verify current figures before transacting.
For demand-side context on the maricopa county housing market, including investor activity, see the Phoenix investor market report covering April 2026 conditions.
Homes for sale and active inventory
Phoenix housing inventory has climbed to levels not seen in over a decade. Active listings reached approximately 24,300 in July 2025, the highest July count since at least 2010, per Redfin data. By early 2026, available inventory for Phoenix proper ranged from roughly 6,000 to 7,400 homes, depending on the geographic boundary used.
New listings fell 10.6% over the past year, but pending sales dropped between 21.8% and 33.2%, per Phoenix New Times and aggregated reporting. When supply holds relatively steady but buyer activity softens further, the unsold backlog grows. That gap is what drove phoenix housing inventory to multi-year highs.
How fast are Phoenix homes selling?
Days on market phoenix averaged 51 to 66 days in early 2026, roughly double the 2021 to 2022 pace. Approximately 7,100 homes closed in March 2026, up 6.8% versus March 2025 per homes.com data, but still about 20% below the 2018 to 2019 pre-pandemic average.
Price reductions phoenix sellers accept now exceed 31% of active listings. Nearly one in three sellers cuts price at least once before closing. The sold-to-list price ratio has declined from its pandemic-era highs across the metro.
Are Housing Prices Falling in Phoenix?
Phoenix home prices are declining by most measures, but the scale depends entirely on which source you read. Four widely cited providers report four different figures, and each is methodologically correct for the question it was built to answer.
Why price data varies by source
| Source | Metric Measured | Current Figure | YoY Change |
|---|---|---|---|
| Redfin | Median closed-sale price (Phoenix city) | $460,000 | -5.2% |
| Zillow | Estimated home value (all Phoenix properties) | $411,323 | -2.4% |
| Norada / Realtor.com | Median listing price (active, unsold) | $485,000 | -3.96% |
| Stacker / homes.com | Median sale price (Phoenix metro, Feb 2026) | $465,000 | -1.5% |
Based on reported data from Redfin, Zillow, Norada, and Stacker, 2026. Verify current figures before transacting.
Redfin counts only homes that actually closed, which gives the most direct read on what buyers paid. Zillow uses an automated valuation model to estimate the value of all properties, including those not listed. Norada and Realtor.com track asking prices for active listings, reflecting seller expectations rather than final transaction prices. When these figures diverge, the closed-sale median is the most reliable guide to where the market is actually transacting.
What the numbers show for 2026
Reviewing phoenix home prices 2026 data across all sources, one direction is consistent: prices are down, but the correction is gradual. Per Phoenix price-decline and affordability data from the Common Sense Institute, Greater Phoenix home prices fell 6.9% from their July 2022 peak through Q1 2025.
The February 2026 median of $465,000 (down 1.5% YoY) and the March 2026 median of $460,000 (down 5.2% YoY) confirm the correction continued into the first quarter. The maricopa county housing market is not collapsing. It is settling at a lower equilibrium as affordability constraints keep demand below historical norms.
Is Phoenix a Buyer’s or Seller’s Market?
Phoenix is a buyer’s market in 2026. Multiple data points and local reporting confirm the shift, and none point back toward seller conditions.
Signs the market has shifted to buyers
Per Phoenix housing market historic buyer shift coverage from KTAR (May 4, 2026), “Valley house hunters are holding the cards as rising supply and flat demand flip the Phoenix-metro housing market in favor of buyers.” The specific indicators behind that call:
- Active listings hit 24,300 in July 2025, the highest July inventory count in over a decade
- Pending sales fell 33.2%, confirming buyers are not absorbing available supply at the current pace
- Price reductions phoenix sellers accept now exceed 31% of all active listings
- Sales volume remains 20% below the 2018 to 2019 pre-pandemic baseline
- The sold-to-list price ratio has declined (arizonarealestatenotebook.com)
- Months supply of inventory is rising, a defining characteristic of a buyer’s market phoenix
Buyer leverage in the phoenix real estate market has not been this strong since 2019.
What sellers need to know right now
Selling a house in phoenix in 2026 means competing in a market with more homes, longer timelines, and buyers who have real choices. With days on market phoenix at 51 to 66 days, carrying costs add two or more months of mortgage payments, taxes, utilities, and insurance compared to two years ago.
Know your full cost of sale before listing. Arizona seller closing costs typically include agent commissions, title fees, and transfer taxes that total 6% to 8% of the sale price. Arizona home sale taxes also affect net proceeds, depending on ownership duration and primary-residence status.
Cash home buyers phoenix offer a defined timeline at a modest discount to market value. For sellers who cannot sustain extended market exposure, that trade-off often produces a better net outcome than a prolonged MLS listing that ends with a price reduction anyway.
Phoenix Migration: Who’s Coming and Going
Migration patterns directly affect housing demand. Both the inbound and outbound sides of the Phoenix flow have shifted in ways that shape the longer-term trajectory of phoenix home values.
Where Phoenix home buyers are moving from
Phoenix continues to attract buyers from high-cost coastal markets, particularly California, where median prices run two to three times higher. The price differential makes Phoenix relatively affordable by comparison, though affordability concerns within Arizona are narrowing that advantage.
Arizona’s phoenix population growth reached 109,400 new residents in the 2023 to 2024 period, a 1.5% year-over-year increase, per Arizona population growth rate data from USAFacts. That is the slowest rate since 2013, a notable deceleration from the pandemic-era surge.
Where Phoenix residents are relocating
Arizona has been a net-negative migration state since 2022, per an ASU study. Texas, Nevada, and lower-cost Sunbelt metros appear most frequently among destinations.
For residents considering staying in state, reviewing the best places in Arizona outside the Phoenix metro helps compare median prices and lifestyle trade-offs. Tucson and Flagstaff both offer lower median home prices than Phoenix proper.
Phoenix population growth is slowing because factors that historically attracted residents now compete directly with factors pushing them out: extreme heat, rising housing costs, and an arizona cost of living running 6% above the national average.
Why Are People Moving Out of Arizona?
Arizona residents are leaving at the highest rate in over a decade. Five factors account for most of the outflow.
-
Housing costs up 47% since 2020. An ASU study found Phoenix households need approximately $123,752 in annual income to afford the median-priced home, more than $44,108 above the actual median household income. Only 13% of Arizonans say housing is affordable, and 1 in 4 seriously considered leaving because of prices, per Arizona housing affordability poll data from Phoenix New Times.
-
Phoenix heat extreme conditions. Phoenix logged 55 days above 110°F in a recent summer, including 31 consecutive days in July. Phoenix ranks as the second fastest-warming city in the United States, per Climate Central. Summer utility costs and the physical limits on outdoor activity are pushing younger residents toward cooler metros.
-
Cost of living above the national average. Arizona cost of living runs 6% above the national average. Combined with phoenix mortgage rates above 6.5% on 30-year fixed products, the monthly principal and interest payment on a $460,000 home exceeds $2,700 before taxes and insurance. That math disqualifies a large share of the local workforce from homeownership.
-
Traffic congestion and urban sprawl. Rapid expansion without matching infrastructure has extended commute times, particularly in outer suburbs like Surprise and Goodyear. Pollution indexes have worsened in certain corridors as vehicle miles traveled increased.
-
Net-negative migration momentum. Arizona has been a net-negative migration state since 2022, per ASU data. When outmigration consistently exceeds inbound migration, the demand base that supports phoenix home values erodes over time.
Will Phoenix Be Livable in 10 Years?
Phoenix will remain physically livable in 10 years, but residents face an estimated 47 days per year above 110°F by 2050 and sustained pressure on water supply that requires active, long-term management.
Heat projections through 2035 and beyond
Per Phoenix climate risk scores and projections from ClimateCheck, Phoenix is on track to reach 47 days annually above 110°F by 2050. The most recent full summer already logged 55 days above that threshold, including 31 consecutive days in July.
Phoenix heat extreme conditions are already reshaping daily life. Nighttime temperatures have risen 10°F over the past 50 years due to the urban heat island effect, per research cited by Claude. That reduces overnight cooling time for both buildings and residents. Phoenix ranks as the second fastest-warming city in the United States, per Climate Central.
Maricopa County is one of six Arizona counties flagged by ClimateCheck at elevated climate risk. Buyers evaluating long-term purchase decisions should factor energy, cooling, and outdoor livability costs into their financial models.
Phoenix water supply: the 100-year plan
The City of Phoenix maintains a Phoenix 100-year water supply assurance through a diversified strategy: groundwater recharge, wastewater recycling, and Colorado River deliveries.
Water scarcity arizona risks are real at the regional level, tied closely to Colorado River allocation cutbacks as Lake Mead levels have declined. Water scarcity arizona planning at the city level, however, is more active than most national headlines suggest. ASU researchers describe Phoenix as “not doomed” but note that challenges are mounting and margins for error narrow if drought conditions extend another decade.
Buyers making long-term housing decisions in the maricopa county housing market should review phoenix.gov’s water resource planning documents alongside ClimateCheck’s risk data before committing.
Neighborhoods to Avoid in Phoenix
Phoenix neighborhoods crime data varies by source and year, but five areas appear consistently at the top of high-risk rankings across multiple providers.
Most dangerous Phoenix neighborhoods
- Central City: crime rate 296% above the national average, with violent crime 631% above the national average, per data aggregated by cookandassociatesaz.com and Phoenix neighborhood crime rankings from RoadSnacks.
- Alhambra: crime rate 165% above the national average, driven primarily by theft and property crime.
- Maryvale: historically high property crime rates including vandalism and theft, flagged consistently by RoadSnacks, PropertyClub, and local reporting.
- South Mountain: property and violent crime above metro averages, regularly appearing in RoadSnacks top-10 phoenix neighborhoods crime rankings.
- Estrella: flagged alongside South Mountain in multiple data aggregator datasets.
RoadSnacks’ broader top-10 also includes New Village, Laveen, Encanto, North Mountain, and Deer Valley.
Crime context and what the data covers
A crime rate listed as “165% above the national average” means 2.65 times the national rate. That is a meaningful signal, but it does not describe every street in the neighborhood uniformly. Property crime and violent crime carry different risk profiles for residents.
These rankings reflect recent available data, and conditions shift. Verify current figures with the Phoenix Police Department’s public crime dashboard or crimegrade.org before making a housing decision. A neighborhood’s profile can change within one to two years.
Phoenix Housing Market Forecast 2026
The phoenix housing market forecast 2026 points to flat to slightly negative prices through year-end, with buyer-favorable conditions persisting through at least the third quarter.
Will prices rise or fall in late 2026?
Phoenix real estate market observers are not predicting a sharp recovery. KTAR (May 2026) describes buyers as holding the cards. Norada’s April 26, 2026 report cited “a slight dip year-over-year” alongside a “notable” inventory trend. Common Sense Institute data shows the correction from the July 2022 peak has been gradual.
Three conditions would need to change for a meaningful price recovery in the phoenix real estate market:
- Phoenix mortgage rates drop enough to unlock rate-locked sellers and bring sidelined buyers back
- Phoenix housing inventory is absorbed faster than new listings arrive
- Phoenix population growth re-accelerates in a sustained way
None appears imminent as of mid-2026. The phoenix real estate forecast from multiple sources describes stabilization, not recovery. Sales volume is improving incrementally (up 6.8% in March 2026 versus March 2025) but remains well below historical norms.
What buyers and sellers should watch for
Buyers should monitor phoenix mortgage rates closely. A sustained move below 6% would likely bring significant latent demand back into the market, compressing the buyer-favorable window. Phoenix housing market trends show pending sales down more than 21%, but that indicator can reverse quickly when financing conditions improve.
Sellers weighing alternatives to a traditional listing should review the Arizona FSBO guide, which covers the full process of selling by owner in Arizona, including required disclosures and negotiation steps that carry extra weight in a buyer’s market.
Sell a Home in the Phoenix Metro
Conditions vary across Phoenix’s suburbs, from investor-heavy corridors to family-oriented communities with different days-on-market and price trajectories. Pick your city below for a local cash-buyer breakdown.
Selling in a buyer’s market means price reductions, extended time on the MLS, and the real risk that a financed buyer walks at inspection. If your timeline matters more than extracting the last dollar from a traditional listing, iBuyer.com connects you with multiple vetted cash home buyers phoenix who compete for your property. You receive competing offers, choose the one that fits your price expectations and close schedule, and complete the sale in as few as 7 days. No agent commission, no repair demands, no contingency clauses. [Get competing cash offers for your Phoenix home]
Compare Cash Offers from Top Home Buyers. Delivered by Your Local iBuyer Certified Specialist.
One Expert, Multiple Offers, No Obligation.
Know Your Local Market Before You List
Pull the last 12 months of real sales and buyer activity for your neighborhood.
Get My Market ReportFrequently Asked Questions
Phoenix home prices fell roughly 2% to 5% year-over-year as of spring 2026, depending on the data source and methodology used. Redfin reports a 5.2% decline in median sale price to $460,000; Zillow shows a 2.4% drop in estimated home values to $411,323. Neither figure is wrong; they measure different things. The market is correcting from its July 2022 peak rather than collapsing outright.
The median sale price in Phoenix was approximately $460,000 in March 2026, while Zillow’s average home value estimate sits at $411,323. The gap reflects different methodologies: Redfin counts only homes that actually closed, while Zillow estimates the value of all homes including those not on the market. Median listing prices (asking prices for active listings) sit higher, around $485,000. Use the closed-sale median when evaluating what buyers actually paid.
Phoenix is a buyer’s market in 2026, with inventory up roughly 27% year-over-year and more than 31% of listings receiving price reductions. The Arizona Association of Realtors described the shift as “historic” in May 2026. Pending sales are down more than 33% compared to the same period last year, and buyers have more leverage than at any point since 2019.
Phoenix price figures differ because Redfin measures median closed-sale prices, Zillow estimates home values, and listing sites measure unsold asking prices. Each metric answers a different question. Closed-sale median reflects what buyers actually paid in recent transactions. Estimated home value reflects algorithmic assessments of all properties. When these diverge, the closed-sale median is the most reliable indicator of where the market is transacting.
Homes in Phoenix spend 51 to 66 days on market in early 2026, roughly double the 2021 to 2022 pace. Extended days on market mean sellers face carrying costs for two or more additional months compared to two years ago. Price-reduction rates above 31% indicate many sellers are overpricing initially and adjusting downward. Realistic pricing at or slightly below comparable sales is more important now than during the pandemic run-up.
Phoenix is a buyer’s market in mid-2026, giving buyers more negotiating room than any period since 2019. Inventory near decade highs and price reductions on a third of listings give buyers genuine leverage. The main constraint is affordability: an ASU study found the income needed to afford the median Phoenix home is $123,752, well above the actual median. Buyers who qualify should find negotiating conditions favorable.
Phoenix will remain physically livable by 2035, but residents face roughly 47 days per year above 110°F by 2050 and ongoing water supply pressures. Climate researchers, including teams at ASU, say Phoenix is not “doomed,” but the city logged 55 days above 110°F in a recent summer. The City of Phoenix maintains a claimed 100-year assured water supply through conservation and wastewater recycling, though Colorado River dependency remains a regional risk.
Arizonans cite housing costs up 47% since 2020, extreme heat, and a cost of living 6% above the national average as top reasons for leaving. A Phoenix New Times poll found 1 in 4 Arizonans seriously considered leaving because of housing prices, and only 13% describe housing as affordable. An ASU study put the income needed to afford the median Phoenix home at $123,752, more than $44,000 above the actual median household income.
Central City, Alhambra, Maryvale, South Mountain, and Estrella are the Phoenix neighborhoods most frequently cited for high crime rates. Central City carries a violent crime rate 631% above the national average and a property crime rate 296% above it. These designations reflect recent data and can shift; verify with local crime dashboards or the Phoenix PD portal before making a housing decision.
An Arizona State University study found Phoenix households need approximately $123,752 in annual income to afford the metro’s median-priced home in 2026. That figure is roughly $44,108 above Arizona’s actual median household income, meaning the typical Phoenix household cannot comfortably afford the median-priced home under standard 28% debt-to-income guidelines. The gap has widened since 2020 as home prices rose over 47% while incomes grew more slowly.
Phoenix active listings climbed roughly 27% year-over-year, reaching 24,300 homes for sale in July 2025, the highest July inventory in over a decade. Despite the inventory surge, the total homes sold in March 2026 (approximately 7,100) remains about 20% below the 2018 to 2019 pre-pandemic baseline. Demand has not kept pace with the new supply.
Phoenix home prices are easing in 2026 because inventory jumped roughly 27% while buyer demand stayed suppressed by high mortgage rates and affordability concerns. New listings recovered but pending sales fell over 21%, creating a growing backlog of unsold homes. When supply grows faster than demand, sellers compete on price. The 31%+ price-reduction rate confirms sellers are adjusting expectations rather than holding firm.
Phoenix home prices are expected to remain flat to slightly negative through late 2026 as elevated inventory and cautious buyer demand persist. Market observers from KTAR to Norada describe the market as stabilizing rather than collapsing. A meaningful price recovery would require either a significant drop in mortgage rates or sustained absorption of the current inventory overhang, and neither appears imminent as of mid-2026.
Greater Phoenix home prices dropped about 6.9% from their July 2022 peak through Q1 2025, partially reversing a pandemic-era surge of over 40%. The correction has been gradual rather than sharp. As of early 2026, prices remain substantially above 2019 levels in absolute terms, meaning buyers who purchased before 2020 remain well above water while those who bought at the peak face paper losses.

Reilly Dzurick is a licensed real estate agent with over six years of experience and a member of the iBuyer.com Market Insights Team, covering national trends in home selling and the evolving iBuyer landscape. Her firsthand experience working with buyers and sellers gives her a practical perspective on how these platforms impact real homeowners. She holds a degree in Public Relations, Advertising, and Applied Communication.