The Denver housing market has cooled, with the median home price hovering around $616,000 as of June 2026. High mortgage rates have created a 41% income squeeze for buyers, 12,744 active listings have accumulated across the metro, and homes now take 18 to 34 days to go pending depending on property type.
The denver real estate market is diverging along segment lines. Single-family home prices rose 1.5% in June 2026 and have gained for five consecutive months. Condo and townhome prices fell roughly 2.85% over the prior year, and closed deals on attached homes dropped 17.8%. That divergence also explains why four major data sources, Zillow, DMAR, Redfin, and Realtor.com, report four different median prices simultaneously. Each measures something different, and this guide explains what each number means for buyers and sellers.
This guide covers the denver housing market 2026 data by segment, the reasons different sources report conflicting numbers, the denver housing inventory picture and days-on-market trends, the denver real estate forecast 2026, the buyer affordability challenge, luxury market trends, the rental landscape, and a cost-of-living comparison with Los Angeles.
Denver Market Has You Competing With 12,744 Listings Get multiple cash offers and close in 7-30 days instead.
No repairs, no commissions, no guesswork.
Denver Housing Market
- Denver Housing Market Overview: 2026 Numbers
- Are Denver Home Prices Dropping?
- Denver Inventory and Days on Market
- Denver Housing Market Outlook for 2026
- Is It a Good Time to Buy in Denver?
- Condos vs. Single-Family Homes in Denver
- Denver Luxury Home Market Trends
- Denver Rental Market in 2026
- Is Denver Cheaper Than Los Angeles?
- Selling a Home in Denver in 2026
- Frequently Asked Questions
Denver Housing Market Overview: 2026 Numbers
Key Market Statistics at a Glance
The table below draws from Denver Metro Association of Realtors June 2026 market data. These figures reflect actual closed sales and active inventory across the metro.
| Metric | Value | Change |
|---|---|---|
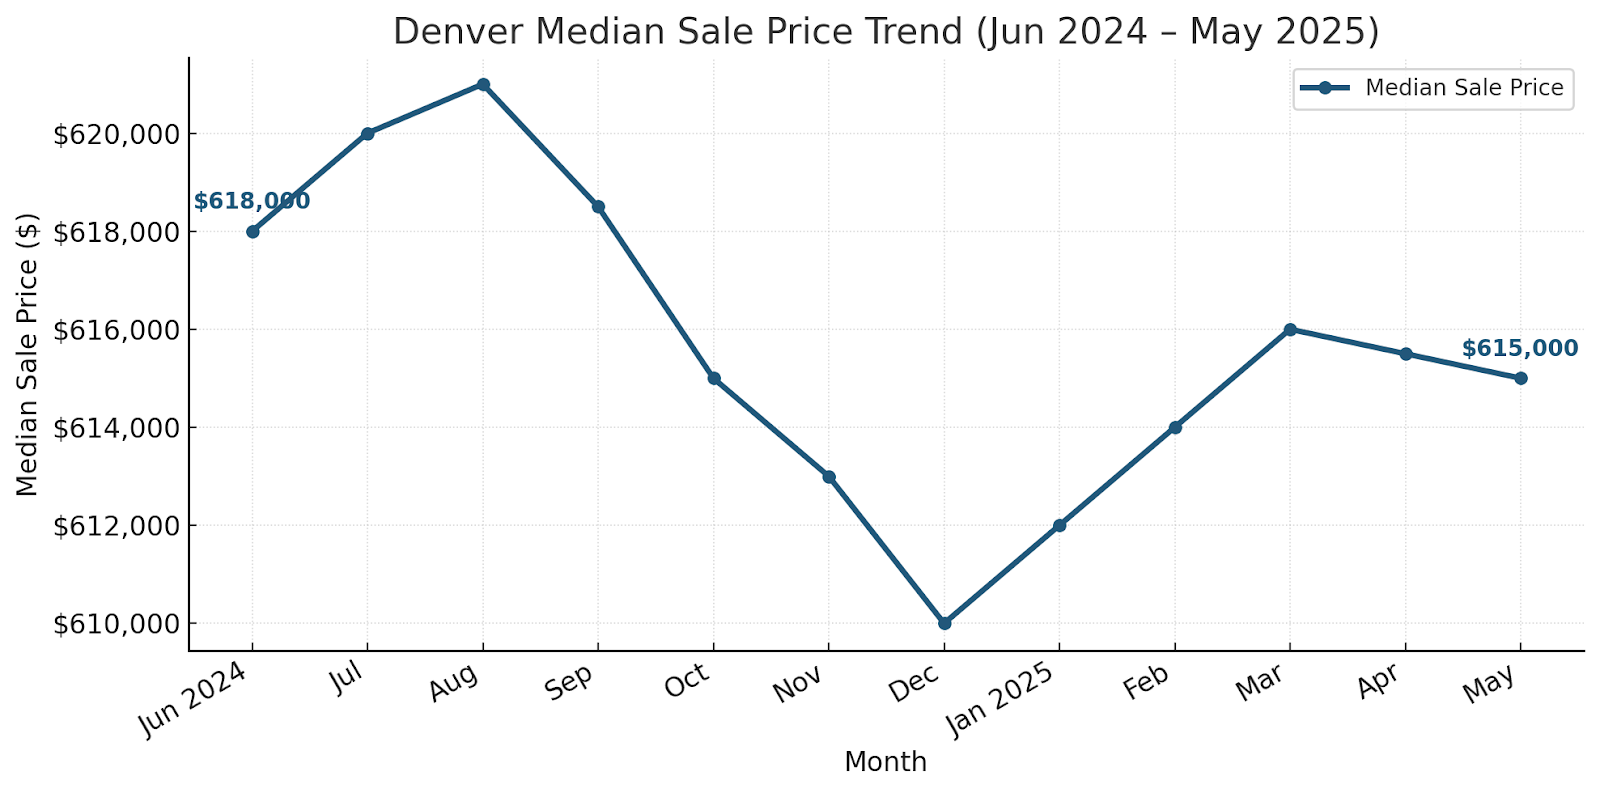
| Median Home Price (DMAR, June 2026) | $616,000 | +1% YoY |
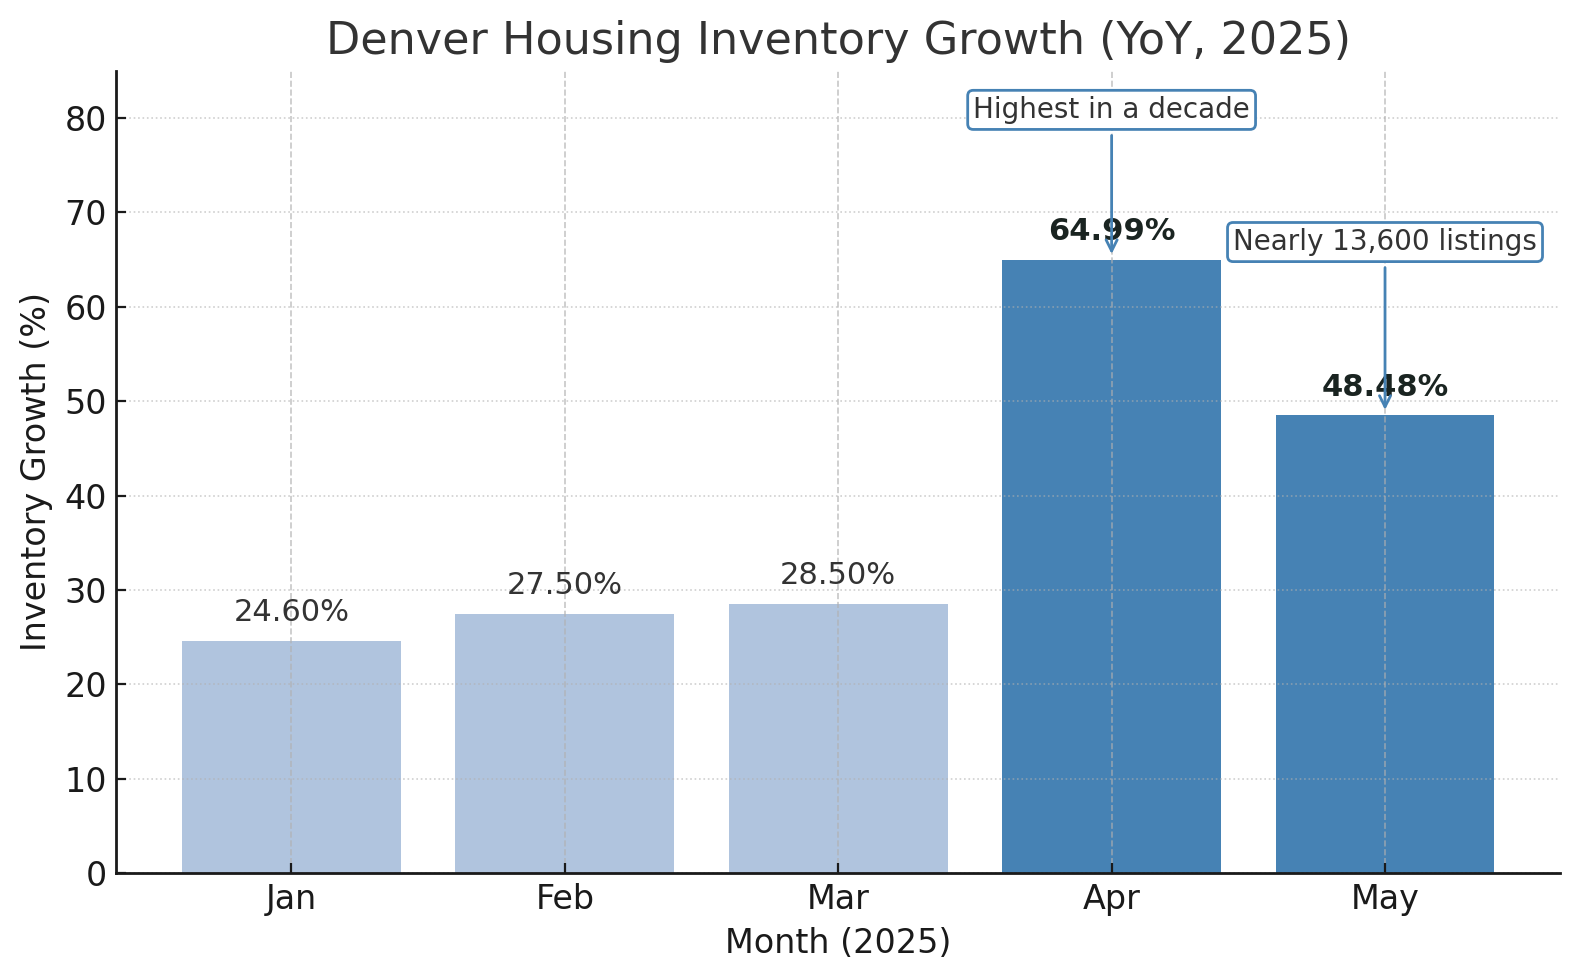
| Active Listings | 12,744 | +64.9% YoY |
| Median Days to Pending (SFH) | 18 days | Up from ~12 in 2022 |
| Median Days to Pending (Attached) | 34 days | Significantly elevated |
| Average Rent | $1,877/mo | Decline YoY |
Based on Denver Metro Association of Realtors (DMAR) and local market data, June 2026. Verify current figures before transacting.
According to the U.S. Census Bureau Denver-Aurora-Lakewood metro profile, the Denver metro is a large, economically diverse region where sub-market conditions differ meaningfully by property type and neighborhood. The denver housing market 2026 inventory picture is its most striking feature: active listings denver-wide have climbed 64.9% year-over-year, the highest level recorded in at least several years and more than double what was available during the 2022 market peak.
Why Different Sources Report Different Prices
If you have looked up the median home price denver from multiple sources and found four different numbers, all four are technically correct. They each measure something different.
Zillow reports an average home value of $538,992, down 3.4% year-over-year. Zillow uses an automated valuation model (AVM) applied to every home in its database, including homes that are not actively listed or recently sold. Including older, unsold inventory pulls its figure below transaction-based sources.
DMAR (the denver metro association of realtors) reports a closed-sale median of $616,000 for June 2026. This figure reflects only homes that closed on the MLS during that month, making it the most transaction-relevant benchmark for buyers and sellers.
Redfin reports a rolling three-month median of approximately $640,000, up 2.5% year-over-year. The multi-month window captures recent higher-priced deals, producing a higher number than a single-month DMAR snapshot.
Realtor.com shows a median listing price of approximately $530,000. This reflects the median asking price of currently active listings, not what homes actually sold for. Asking prices are often set aspirationally and do not reflect final sale prices.
For buyers evaluating fair market value: anchor to DMAR’s $616,000 closed-sale median. For sellers setting a list price: compare active asking prices against DMAR’s sold median to calibrate where the market will actually transact.
Are Denver Home Prices Dropping?
Denver home prices are not dropping uniformly. Single-family homes are rising while condos and townhomes have declined, and the split between those two segments is the defining pattern of the denver housing market 2026.
Here is the segment-level picture:
- Single-family median: $675,000 in June 2026, up 1.5% year-over-year (DMAR)
- Five consecutive months of single-family price gains through mid-2026
- Attached home prices: down 2.85% from 2025 levels (DMAR data)
- Attached closed deals: down 17.8%, sharper than the overall -7% market decline
Single-Family Home Prices in Denver
Single-family price trends are stronger than broad averages suggest. The $675,000 June 2026 median represents five consecutive months of gains, and detached home prices in the broader metro rose 0.39% in full-year 2025 before accelerating into 2026. The overall metro closed-price median held at $585,000 for two consecutive months at mid-year, showing price stability rather than decline.
Condo and Townhome Prices in Denver
The denver condo market is under meaningful pressure. Attached home prices fell roughly 2.85% in 2025, closed deals fell 17.8%, and the median time to pending for condos and townhomes sits at 34 days versus 18 days for single-family homes.
The Common Sense Institute Denver affordability report provides context: Denver home prices have increased 138% from a $260,600 baseline to approximately $619,500. That generational appreciation compresses denver affordability hardest for first-time buyers, who represent the core demand pool for condos and attached homes.
What the Case-Shiller Index Shows
The case-shiller denver figure (S&P CoreLogic Case-Shiller Index) showed Denver as the fastest-falling major U.S. metro in February 2026, at -2.2% year-over-year. This index blends all residential segments. Because transaction volumes currently skew toward the weaker attached segment, the composite reads negative even as single-family prices rise.
The Case-Shiller reading does not signal a market collapse. It reflects the math of blending two diverging segments. Separating them reveals a single-family market that is appreciating and an attached market that is declining.
Denver Inventory and Days on Market
Supply is the structural driver of Denver’s market shift. Denver housing inventory has expanded faster than demand can absorb it, and that surplus shows up clearly in both the listing count and the time homes take to find a buyer.
Active Listings at Record Levels
Denver housing inventory stood at 12,744 active listings at the end of June 2026, a 64.9% year-over-year increase and the highest level the metro has recorded in at least several years.
According to REcolorado metro market statistics, there were 3,448 closed listings in the most recent reporting period, while buyers closed on 3,506 homes (a 7% increase in buyer activity). New listings were down 5% year-over-year. The inventory buildup is not driven by a surge of new supply. Homes are staying on the market longer, creating a stockpile that has roughly doubled since 2022. Buyers in a given price range who found five or ten options in 2022 now find twenty or more.
How Long Homes Sit Before Going Pending
Denver days on market differ sharply by property type:
- Single-family homes: median 18 days to pending (up from approximately 12 days in 2022)
- Attached homes (condos and townhomes): median 34 days to pending
The metro sits at approximately 1.4 months of supply, technically below the four-to-six month range that defines a traditional buyer’s market. However, the pace of change matters. Supply has moved from under one month in 2022 to 1.4 months in mid-2026, and the attached segment is carrying most of that excess. Closed sales dropped roughly 7% month-over-month during mid-2026, adding further upward pressure on inventory levels.
Denver Housing Market Outlook for 2026
The denver real estate forecast 2026 points to a balanced market with price movement in the 0-3% range through year-end. The specific direction depends on segment and mortgage rate movement.
Price Forecast Through Year-End 2026
The FRED House Price Index for Denver-Aurora-Lakewood metro shows four consecutive flat quarters:
| Quarter | FRED All-Transactions Index |
|---|---|
| Q2 2025 | 495.63 |
| Q3 2025 | 494.78 |
| Q4 2025 | 496.97 |
| Q1 2026 | 496.42 |
Source: Federal Reserve Bank of St. Louis (FRED), series ATNHPIUS19740Q. Verify Q2 2026 reading at publication.
Four flat quarters after the 2022-2023 correction is consistent with a market finding equilibrium, not heading toward sharp decline or a new appreciation run. The denver real estate forecast 2026 from most local analysts anticipates 0-3% annual price growth through year-end for the metro as a whole, with single-family outperforming and attached continuing to lag. The denver real estate market in the luxury tier ($1.5 million to $2 million) is a notable outlier: that segment has surged even as the mid-range has stalled, driven by cash buyers who are not subject to rate pressure.
How Mortgage Rates Are Shaping the Market
Mortgage rates colorado currently sit in the low-to-mid 6% range. At 6.5% with a 20% down payment on a $616,000 purchase, monthly principal and interest runs approximately $3,127. Adding property taxes, homeowner’s insurance, and HOA fees (where applicable) typically brings total monthly PITI to approximately $3,900 or higher.
That payment load creates the mid-market freeze. Buyers who could qualify for a $500,000 home at 3% in 2021 are now stretching to qualify for the same home at 6.5%, and many cannot.
For buyers: mortgage rates in the low-to-mid 6% range keep monthly costs elevated, but elevated inventory means buyers who can qualify hold genuine negotiating leverage on both price and terms.
For sellers: flat-to-modest appreciation means pricing competitively below active comparable listings matters more in 2026 than it did in 2022, when almost any list price eventually found a buyer.
Is It a Good Time to Buy in Denver?
Buying conditions in Denver have improved substantially since 2022, but denver affordability remains a real obstacle at a $616,000 median price paired with mortgage rates in the low-to-mid 6% range.
Buyer Advantages in Today’s Market
Inventory above 12,000 active listings has restored negotiating tools that were effectively unavailable during the 2020-2022 frenzy:
- Inventory more than double 2022 levels: buyers face fewer competing offers and have longer decision windows
- Seller concessions are now common: buyers can request closing cost contributions, repair credits, and rate buydowns
- Inspection contingencies are back: buyers can request repairs from findings rather than waiving contingencies to compete
- Fewer bidding wars: homes receiving five to ten offers above asking in 2022 now typically receive one to three at or near list price
- Price stability: the median closed price held at $585,000 for two consecutive months at mid-year, meaning prices are not spiking
The CFPB guide to mortgage costs and rate buydowns explains how seller-paid rate buydowns work in practice, a concession type that buyers in Denver can now realistically negotiate and receive.
If you are evaluating a fixer-upper, the distressed home guide explains what sellers of below-average condition properties face, which helps buyers understand how much pricing flexibility those sellers typically have.
The Affordability Challenge in Denver
Unattainability fatigue describes the exhaustion Denver buyers feel after years of high prices compounded by high rates. Denver home prices have increased 138% from a $260,600 baseline to approximately $619,500, per the Common Sense Institute’s affordability research. High mortgage rates have created a 41% income squeeze, meaning the same household that could comfortably afford a median Denver home at lower rates must now allocate a substantially larger share of gross income to housing costs.
Buyers are particularly hesitant on fixer-uppers unless sellers price them well below market. A high-rate loan combined with renovation costs produces a carrying cost that is difficult to justify against flat appreciation. The buyer’s market conditions exist in supply and negotiating terms, but the affordability math for median-income households remains genuinely challenging.
Condos vs. Single-Family Homes in Denver
No ranking competitor currently publishes an explicit segment comparison of denver home prices using 2026 DMAR data. The table below fills that gap and is the clearest single view of why “are prices dropping?” has two different answers depending on what you are buying.
| Metric | Single-Family | Attached (Condos/Townhomes) |
|---|---|---|
| June 2026 Median Price | $675,000 | Declined ~2.85% vs. 2025 |
| YoY Price Change | +1.5% | -2.85% (2025) |
| Median Days to Pending | ~18 days | ~34 days |
| Closed Deals Trend | Rising 5 consecutive months | Down 17.8% |
Based on DMAR June 2026 market data and reported segment-level statistics. Verify current DMAR monthly report before transacting.
Single-Family Home Trends
Single-family properties in Denver have been appreciating steadily since early 2026. The $675,000 June median represents five consecutive months of price gains, and detached home prices rose 0.39% in full-year 2025 before accelerating into 2026. Well-priced single-family homes in sought-after neighborhoods still attract competitive interest, though at lower offer volumes than the 2022 peak.
Attached Home and Condo Trends
Attached homes denver are underperforming for three connected reasons. First, condo and townhome buyers skew toward first-time buyers and lower-income households, the groups most constrained by the 41% income squeeze from higher rates. Second, HOA fees on attached properties add a recurring monthly cost that reduces how much buyers can allocate to principal and interest, compressing effective purchasing power below the stated median. Third, buyers are bypassing fixer-upper condos unless the discount is significant, because a high mortgage rate combined with HOA fees and deferred maintenance creates a monthly carrying cost that is hard to justify against current rents.
The combination of these pressures explains why the denver condo market shows 34-day pending times and closed deals down 17.8%, while single-family sits at 18 days with a rising price trend. This segment breakdown provides the deeper context behind the Case-Shiller decline covered in the price trends section above.
Denver Luxury Home Market Trends
Denver luxury homes, particularly those priced between $1.5 million and $2 million, have surged even as the broader mid-range market has stalled. The luxury segment operates largely independently of the affordability constraints shaping the rest of the market.
High-end buyers bypass rate pressure through large down payments and all-cash offers. At a $1.5 million purchase price with a 40% down payment, the loan drops to $900,000, and many buyers at this tier pay cash entirely. Neither scenario is rate-sensitive the way a financed median-priced purchase is.
The contrast with the mid-market freeze is pronounced. Buyers in the $400,000 to $800,000 range depend overwhelmingly on financing, and the low-to-mid 6% rate environment limits them hardest. Cash buyers dominate the luxury segment, insulating it from the rate-driven hesitation affecting financed buyers throughout the rest of the metro. The case-shiller denver composite figure captures the mid-market drag more than the luxury strength, which is part of why the broad index reads weaker than the luxury segment feels on the ground.
Denver Rental Market in 2026
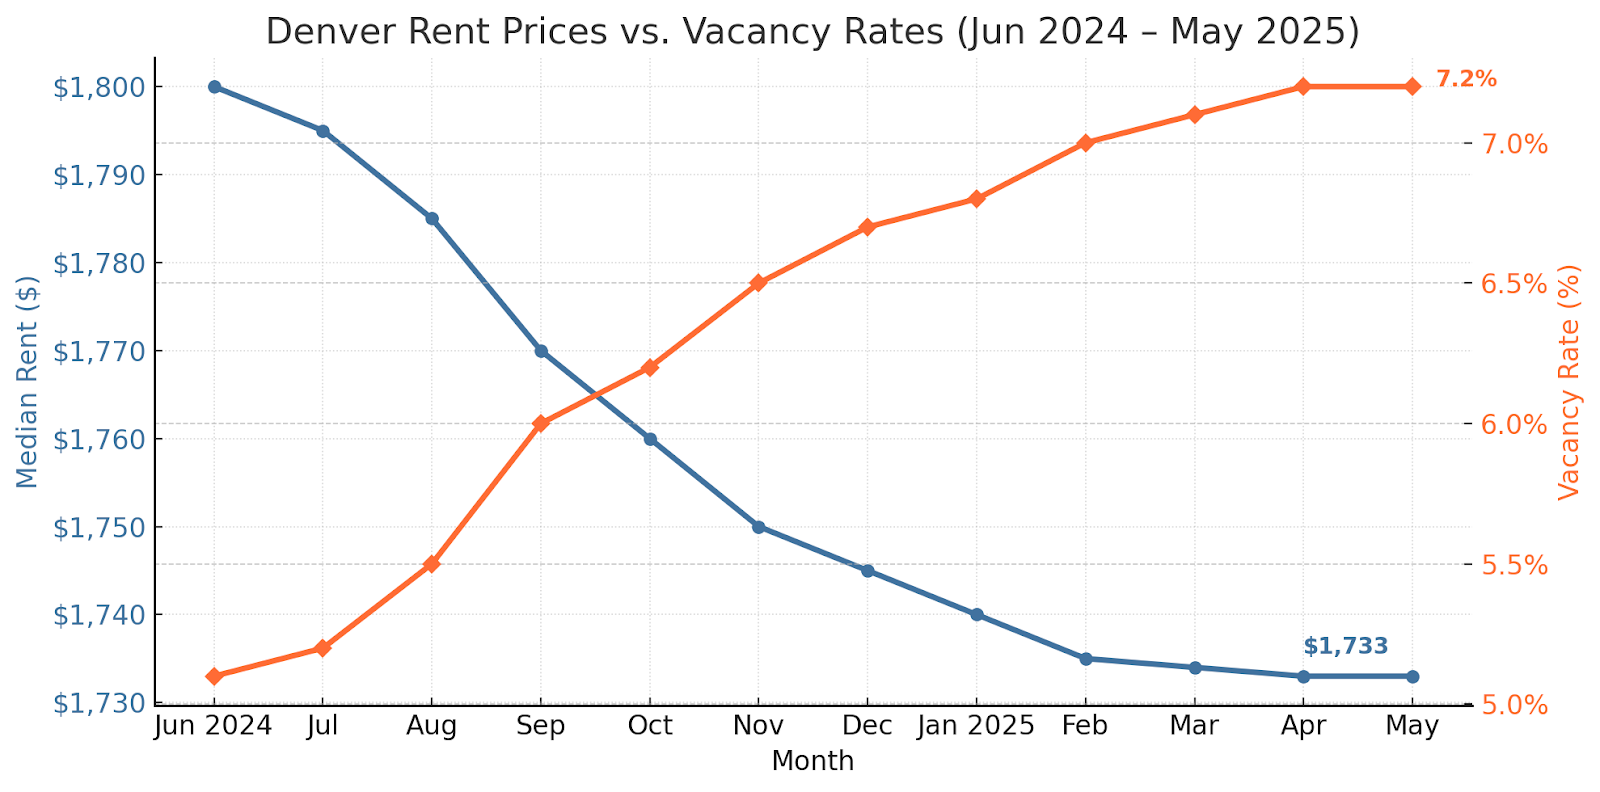
The denver rental market is notably more favorable for tenants than the for-sale market is for buyers. Average rent in the Denver area is approximately $1,877 per month, below the national average and declining year-over-year, according to Apartment List Denver metro rental market data.
That figure contrasts sharply with ownership costs. At the $616,000 median price with a 20% down payment and a 6.5% mortgage rate, monthly principal and interest runs approximately $3,127. Adding property taxes (roughly $300 to $400 per month), homeowner’s insurance ($150 to $200 per month), and HOA fees where applicable brings total monthly PITI to approximately $3,900 or higher, more than double the average rent.
New apartment supply across the Denver metro has increased in recent years, putting downward pressure on rents even as for-sale prices have plateaued. The rent-versus-own gap is one reason many potential buyers are staying on the sidelines, contributing to slower sales volumes. For investors evaluating rental property purchases, the spread between ownership cost and achievable rent is a meaningful headwind to positive cash flow at current prices.
Is Denver Cheaper Than Los Angeles?
Denver’s overall denver cost of living is approximately 20% to 38% lower than Los Angeles, with housing representing the largest share of that gap. According to the BestPlaces cost-of-living index comparison for Denver vs. Los Angeles, a monthly expenditure of $7,323 in Denver is equivalent to approximately $8,900 in Los Angeles, a gap of roughly 21% at typical spending levels. Broader estimates that weight housing more heavily put the gap at approximately 37.9%.
Housing Costs: Denver vs. Los Angeles
| Expense | Denver | Los Angeles | Denver Advantage |
|---|---|---|---|
| Median Home Price (2026) | ~$616,000 | ~$944,000 to $1,049,372 | ~35-40% lower |
| Average 1BR Rent | ~$1,877/mo | ~$2,800/mo | ~33% lower |
| Monthly Utilities | ~$348 | Higher | ~7% below national avg |
| State Income Tax | 4.4% flat | Up to 13.3% | Substantially lower |
| Overall CoL Index | Baseline | 20-38% higher | 20–38% lower overall |
Based on BestPlaces cost-of-living index, local market data, and state tax authority data for 2026. Verify current rates before making relocation decisions.
The housing gap drives most of the difference. Los Angeles median home prices range from approximately $944,000 to over $1,049,372, compared to Denver’s $616,000 to $635,000 range. That is a $330,000 to $430,000 gap at the median, translating to roughly $1,700 to $2,200 per month in lower mortgage payments on a financed purchase.
Other Cost Factors: Rent, Utilities, Taxes
Colorado utilities run approximately $348 per month, roughly 7% below the national average. Los Angeles utility costs tend to run higher due to electricity rate structures and natural gas pricing.
Colorado’s flat 4.4% state income tax is a substantial advantage over California’s graduated rate structure, which reaches 13.3% at the top bracket. For a household earning $150,000 per year, that difference amounts to roughly $13,000 or more in annual state income tax savings, depending on deductions and filing status.
Grocery, transportation, and healthcare costs are broadly comparable between the two metros, with Denver holding a modest edge on most categories. The total cost gap is dominated by housing and taxes, which is where the financial math changes most substantially for relocating households.
Selling a Home in Denver in 2026
What Sellers Face in a Record-Inventory Market
Sellers entering the denver real estate market in mid-2026 face a substantially more competitive environment than in 2022. With 12,744 active listings across the metro, every home competes against dozens or hundreds of comparable properties in its price range. Buyers have time. They request concessions, ask for repairs, and sometimes ask sellers to contribute to rate buydowns. Unattainability fatigue affects sellers too: many remain anchored to 2021-2022 peak price expectations and resist reducing list prices, contributing to 18-to-34 day pending timelines instead of the five-to-seven day pace of 2022.
Fixer-uppers face the most challenging conditions. Buyers already stretched on monthly payments at current mortgage rates are not inclined to add renovation budgets on top. A distressed property needs meaningful pricing below market comparables to attract serious interest.
Sellers can use the Colorado net proceeds calculator to model what commissions, concessions, and closing costs mean for actual take-home proceeds before committing to a listing strategy. Sellers who need to move on a defined timeline can review sell fast in Colorado for a comparison of traditional listing timelines versus cash-sale alternatives in the current market. And sellers exploring alternatives to a traditional listing can compare offers through cash buyers in Colorado to see how competing cash offers stack up against list-price expectations.
Denver Area Market Guides by Zip Code
Market conditions vary across Denver’s zip codes. Select an area below for a neighborhood-level breakdown.
Denver’s record inventory and longer market times mean sellers now compete against 12,744 other active listings. If you are considering selling, getting multiple cash offers through iBuyer.com lets you compare real numbers against your list-price expectations without the uncertainty of open houses, price reductions, or a buyer’s financing falling through. Most sellers receive competing offers within 24 hours. Closing takes 7 to 30 days rather than 60 to 90. No repairs, no agent commission, no waiting. Get your competing cash offers from vetted Denver-area buyers.
Denver Market Has You Competing With 12,744 Listings Get multiple cash offers and close in 7-30 days instead.
No repairs, no commissions, no guesswork.
Frequently Asked Questions
Denver’s single-family home prices are rising (up 1.5% in June 2026) while condo and townhome prices have declined roughly 2.85%. The divergence between segments is the defining pattern of the 2026 Denver market. Broad averages from different data sources mask this split, so check segment-level DMAR data before drawing conclusions about your specific property type.
The median home price in Denver is approximately $616,000 as of June 2026, according to the Denver Metro Association of Realtors. This figure reflects homes that actually closed on the MLS and is the most reliable benchmark for buyers and sellers; other sources report different figures based on their methodology.
Four major sources report different Denver home prices because each measures something different, from Zillow’s automated valuation model to DMAR’s closed-sale median. Zillow’s $538,992 includes all homes in its database (including unsold ones), DMAR’s $616,000 covers only MLS-closed sales, Redfin’s rolling three-month median runs approximately $640,000, and Realtor.com’s $530,000 reflects active listing asking prices. For buying and selling decisions, DMAR’s closed-sale median is the most transaction-relevant figure.
Denver home prices are not dropping uniformly: single-family prices rose 1.5% in June 2026 while attached home prices fell roughly 2.85% over the prior year. The S&P CoreLogic Case-Shiller Index showed -2.2% year-over-year for Denver in February 2026, but that figure blends both segments. Whether prices are “dropping” for you depends entirely on the property type you are buying or selling.
Denver had 12,744 active listings at the end of June 2026, up 64.9% year-over-year. This is the highest inventory level the Denver metro has recorded in at least several years, more than double the number available during the 2022 market peak.
In Denver, single-family homes take a median of 18 days to go pending, while condos and townhomes take about 34 days. Well-priced single-family homes in desirable neighborhoods can still go faster, while overpriced or condition-challenged condos are sitting considerably longer.
Denver is shifting toward a balanced market in 2026, giving buyers more negotiating power than at any point since 2020. With 12,744 active listings and extended days-on-market, buyers can take more time and request concessions, though the market is not yet a pure buyer’s market, particularly for well-priced single-family homes.
Buying conditions in Denver have improved substantially compared to 2022, with inventory more than double prior-peak levels and buyers holding meaningful negotiating leverage. The main challenge is affordability: the $616,000 median price paired with mortgage rates in the low-to-mid 6% range creates a monthly payment requiring a significant share of median household income.
The denver real estate forecast 2026 points to a balanced market with 0-3% price growth and elevated inventory through year-end. The FRED All-Transactions House Price Index for the Denver-Aurora-Lakewood metro has remained essentially flat for four consecutive quarters (Q2 2025 through Q1 2026), with most local forecasts anticipating continued stability rather than sharp appreciation or decline.
Average rent in the Denver area is approximately $1,877 per month, below the national average and declining year-over-year. This puts Denver’s rental market in a notably different position from its for-sale market: renting has become more affordable relative to prior years as new apartment supply has come online across the metro.
Denver’s overall cost of living is approximately 20% to 38% lower than Los Angeles, with the biggest gap in housing. The median Denver home price is approximately $616,000 versus Los Angeles medians of $944,000 to over $1,000,000, and average Denver rent ($1,877 per month) is roughly 33% lower than comparable Los Angeles units.
Unattainability fatigue describes the exhaustion both Denver buyers and sellers feel after years of high prices, high rates, and slow market movement. Buyers are weary of stretching budgets for homes that remain expensive even as prices plateau, while sellers anchor to 2021-2022 peak expectations and resist price cuts, leaving both sides stuck and contributing to low sales volumes.
Denver’s condo and townhome market has weakened, with attached home prices down 2.85% in 2025 and closed deals falling 17.8%. The condo segment is more exposed to rate sensitivity because condo buyers tend to be first-time buyers and investors, both groups most constrained by mortgage rates in the low-to-mid 6% range.
The Denver luxury market, particularly homes priced between $1.5 million and $2 million, has surged while the mid-range market has cooled. High-end buyers bypass interest rate pressure through large down payments and all-cash offers, insulating the luxury segment from the affordability squeeze affecting buyers in the $400,000 to $800,000 range.
Jordan Wagner is an iBuyer Certified Specialist who helps Denver-area homeowners navigate today’s fast-changing housing market with clarity and confidence. With years of local expertise and a deep understanding of iBuyer programs, cash offers, and traditional sales, Jordan provides straightforward guidance tailored to each client’s situation. Whether you’re exploring the fastest way to sell, weighing multiple offers, or planning your next move, Jordan brings a data-driven, client-first approach that ensures you make informed decisions. Known for his dedication and local market insight, Jordan has earned a reputation as one of Denver’s most trusted housing advisors.