
The iBuyer revolution is underway and it’s already reshaping how investors buy homes, how homeowners sell homes, how quickly real estate transactions happen, and the prices transactions happen at— which raises many questions: Is this a good thing for homeowners? When is the best time to sell to an iBuyer? What types of homes are iBuyers looking to buy? Are iBuyers paying a fair value? Perhaps more generally, can we decode the artificial intelligence which is driving their buying decisions?
Our research uncovers the fundamentals of the largest national iBuyers in real estate today: Do iBuyers like Opendoor and Zillow and Offerpad want a two bedroom home in Kansas? Do their ai models prefer purchasing homes in the Spring like human buyers, or do they exploit human behavior to purchase houses below market value, during different times of year, in different places, and for different reasons?
It’s All About the Data

To provide answers, we dive deep into the data — reverse engineering the ai by analysing over 20,000 known iBuyer transactions during all of 2019 — drawing insights to put the power of Big Data in the hands of the little guy, homeowners.
iBuyer.com publishes iValuation instant offer home valuations for millions homes across the country, and uses machine learning models which consume dozens of data inputs directly, and thousands more indirectly, for each individual home. To calculate the iValuation, iBuyer.com uses sophisticated and proprietary algorithms that incorporate data from county and tax assessor records, as well as valuation’s from 3rd party data providers which incorporate direct and indirect feeds from hundreds of multiple listing services and brokerages.
Measuring iBuyer Fairness
The ratio of the price an iBuyer pays for a home vs the price the iValuation says the home is worth, is a simple way to understand whether homeowners are getting a “good deal” when selling to iBuyers. Throughout this paper we call this measure fairness.
Our analysis consists of the big three national iBuyers: Opendoor, Zillow and Offerpad. We study the data for all of 2019 to draw insights with respect not only to fairness, but also geographic location, seasonality, and even bedroom counts — giving you unparalleled insight into the enigma of iBuyer purchasing behavior.
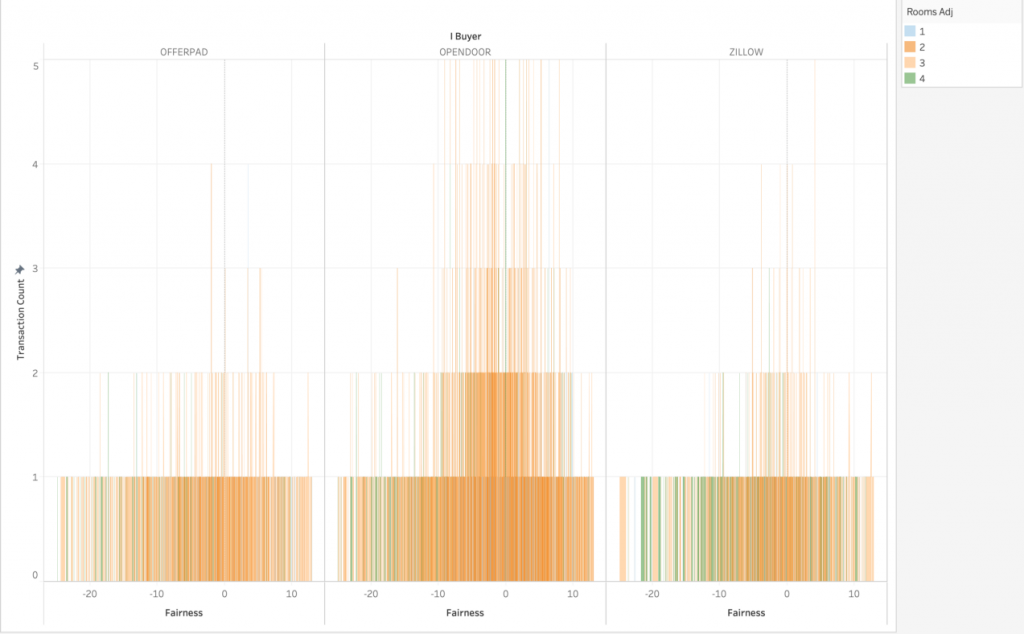
On the fairness axis (x-axis) in the chart above you can see a value of zero (0) which indicates the iValuation amount. To the right of 0 indicates cases where iBuyers paid a premium above the iValuation, and to the left of 0 indicates a discount below the iValuation (measured as a percentage %). The height of the bars indicates the count of homes purchased at that particular fairness (in decimal hundredths). Thus, for each national iBuyer, we can get a sense of total transaction volume in 2019, and generally speaking, how their offers compare to the iValuation for homes with 1 to 5 bedrooms.
Cash Offers on your home? You’re in the right place!
- No Showings
- No Repairs
- No Headaches
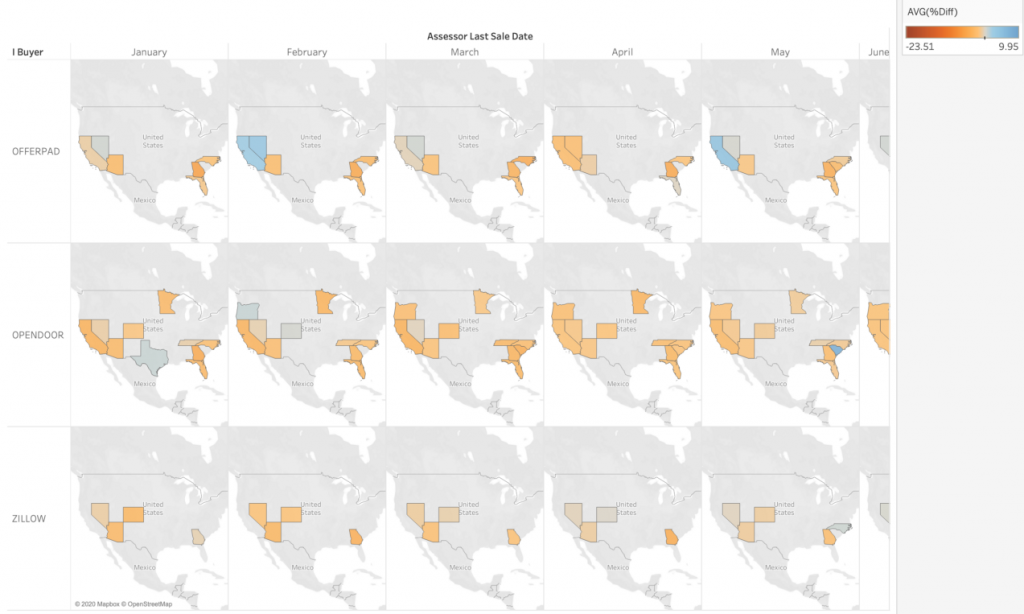
Zillow says it’s “common knowledge” that Spring is prime real estate season, particularly for sellers. But that assumes a marketplace of human buyers and sellers with human motives, not algorithms. Algorithms don’t care if it’s easier to move because the kids just got out of school for summer break. Algorithms don’t care if the weather is better in Spring for loading a truck full of furniture. Algorithms don’t care if it’s peak hiring season for employers. Algorithms don’t have “baby algorithms” which prompt them buying your home because they outgrew their prior home. In fact, it would make sense to look for algorithmic behavior which aims to exploit these sorts of human behaviors.
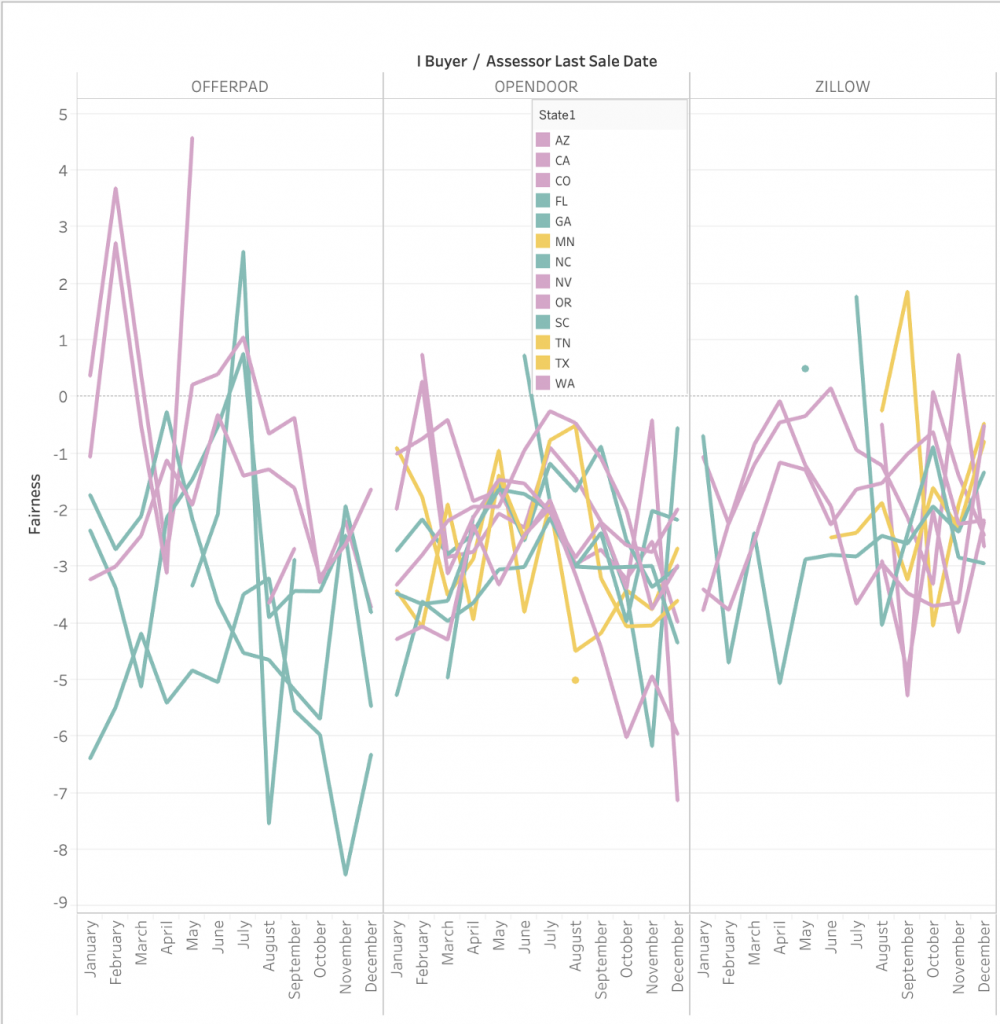
In the chart above we’ve grouped US States by the geographic regions West, Midwest, and East. Looking at this chart we gain a few insights — first, if you’re a homeowner in a Western state, both Opendoor and Offerpad appear to have their highest fairness in January and February, whereas Zillow fairness peaks in later months (March through June). We can even get a bit more granular on these Western states to see what’s happening under the hood.
Like Zillow, many people say the ideal time of the year to sell is Spring, but that‘s certainly not always true. The right answer really depends on where you live, and what type of home you have.
“Nationwide, homes listed for sale between May 1 and May 15 tended to sell for about 0.7 percent more (or roughly $1,600 on the typical U.S. home) and about six days faster than usual. And while the exact best time to list a home varies from market-to-market, in most cases the magic window falls squarely in spring.”
Zillow
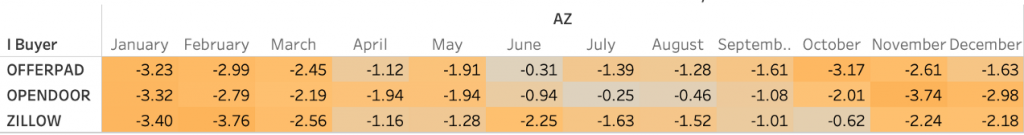
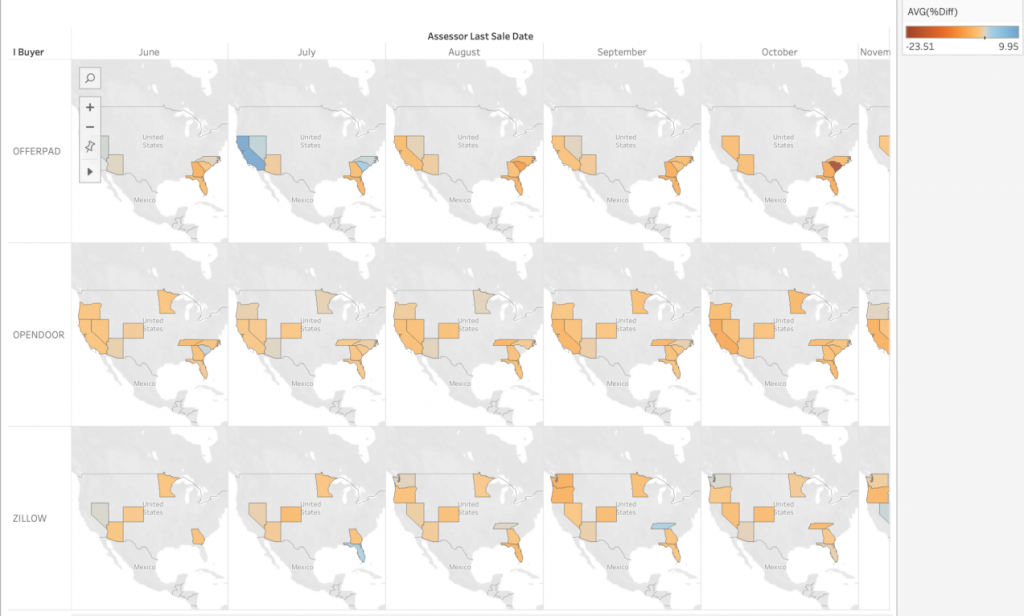
Zillow says the above is true for the normal marketplace. But is it accurate if we consider a marketplace full of iBuyers? It depends. There’s a lot of uncertainties in a study like this, and we can’t be 100% sure. However, looking at Zillow data above, it appears that southern states like Florida and Georgia don’t necessarily experience “abnormally high” fairness for the month of May. In fact, in Georgia, our study indicates that Zillow offers are best during January.
It’s interesting that in states like Florida and Georgia there appears to be less variance in seasonal fairness across all iBuyers, which we could interpret to mean that states in the south which experience less seasonal weather patterns, also experience less variance in seasonal real estate valuations.
Let’s take a minute to break-down some useful tips from these charts.
Tips for selling to iBuyers in the Spring
- Data shows higher fairness for Zillow in April and May.
- Offerpad and Opendoor show higher fairness [in Western states] earlier in the year —during January, February, and March.
What size of house do iBuyers like to buy?
While iBuyers certainly buy many types and sizes of homes in many different areas, we wondered wether we could find any so-called “buy boxes” which might be able to help you out as a seller?
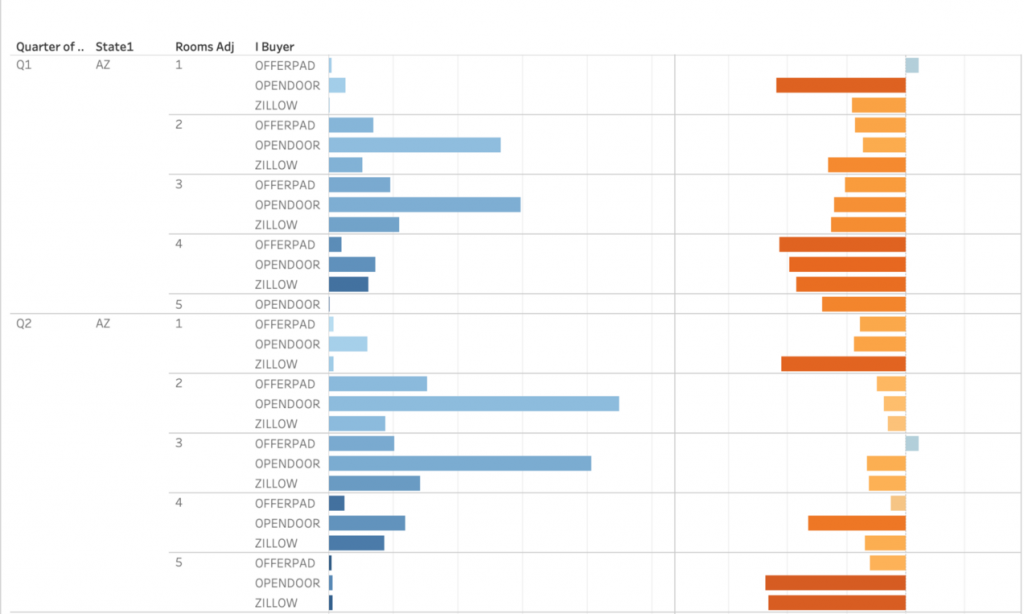
In the charts shown below we do a deep dive and break it down by fairness, transaction volume, and iValuation price, for each annual Quarter and for each size of house [measured by bedroom count].
NOTE: Due to various inconsistencies in the data, we’ve made some adjustments which attempt to “fill-in” a few missing pieces. The reasons we need to clean the data in this way are many, but could include that some counties or states don’t report the number of bedrooms even while they do report numbers for “total rooms” along with “bathrooms” — thus, in such cases we can make assumptions and calculations which [hopefully] get us closer to a bedroom count which we can use as a standard measure throughout.
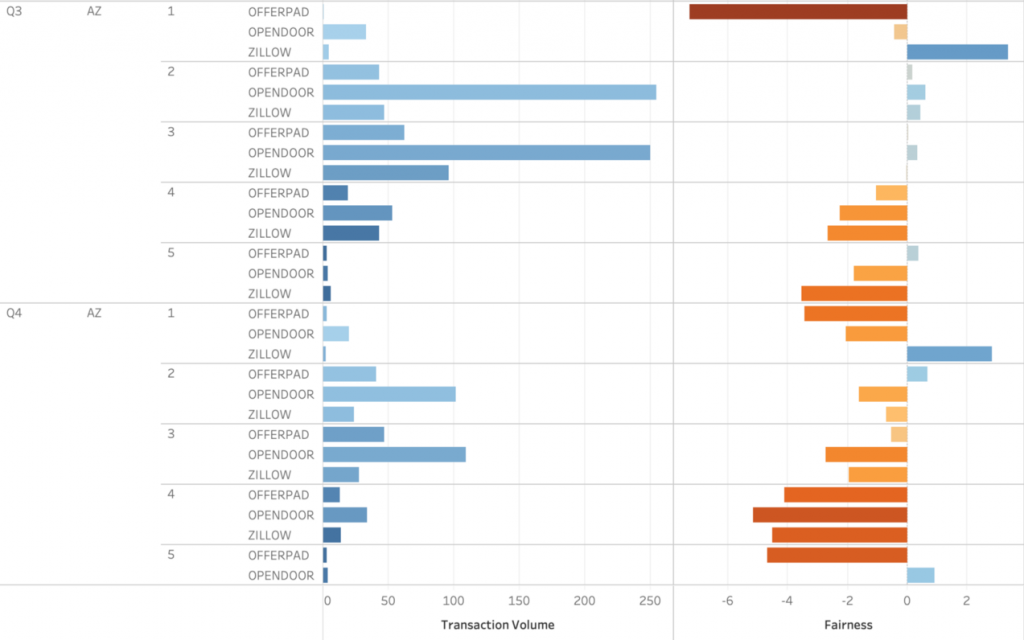
So, let’s do a little interpretation.
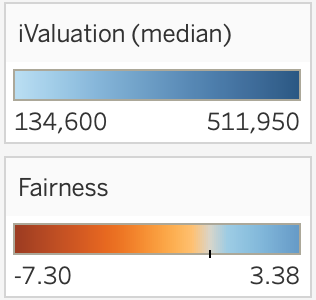
First, note how the majority of all iBuyer transaction volume in Arizona happens in Q2 and Q3. Next, note the preferences for room count for each iBuyer. In the lefthand column, the darker blue indicates a higher iValuation price, and we can see that this clearly correlates with the bedroom count, which makes perfect intuitive sense.
From a homeowner’s perspective, there’s a few peculiarities which pop-out at us. In the righthand column, the blue indicates a fairness value above the iValuation price, meaning that iBuyers are paying a premium in these cases. In fact, it’s very interesting to see that in Q3 in Arizona, our study indicates that all national iBuyers are paying a premium for 2–3 bedroom homes, which is hugely useful to know for potential home sellers. And not only are they paying a premium, they’re doing so during a period of relatively high transaction volume.
While we would have to dive even deeper to learn for sure whether this trend indicates a real-world premium, or whether it’s something else (for instance, perhaps all iBuyers entered a new super-trendy neighborhood with a lack of historical data which, when combined with new home buyer feeding frenzies, skews our iValuation for this subset of transactions) — it’s fascinating to learn where the data can lead us!
Like and follow our blog and visit iBuyer.com for more great data-based insights in the iBuyer revolution!
For 10+ years I’ve been immersed in entrepreneurial software development creating business intelligence tools and predictive analytics models. I have extensive experience developing machine learning and mathematical and statistical modelling algorithms for price forecasting, image classification & object detection, and natural language processing.